
| Marks | 10 | 20 | 30 | 40 | 50 | 60 | 70 | 80 | 90 |
| Frequency | 1 | 1 | x | 5 | y | 1 | 4 | 3 | 1 |
The frequency distribution shows the marks distribution of a class of 30 students in an examination.
The mean mark of the distribution is 52.
(a) Find the values of x and y.
(b) Construct a group frequency distribution table starting with a lower class limit of 1 and class interval of 10.
(c) Draw a histogram for the distribution
(d) Use the histogram to estimate the mode.
Explanation
(a)
| Marks(x) | Frequency (f) | fx |
| 10 | 1 | 10 |
| 20 | 1 | 20 |
| 30 | x | 30x |
| 40 | 5 | 200 |
| 50 | y | 50y |
| 60 | 1 | 60 |
| 70 | 4 | 280 |
| 80 | 3 | 240 |
| 90 | 1 | 90 |
| Total | 16 + x + y | 900 + 30x + 50y |
\(\sum f = 16 + x + y = 30\)
\(\implies x + y = 14 ... (1)\)
\(\bar{x} = \frac{\sum fx}{\sum f}\)
\(52 = \frac{900 + 30x + 50y}{30}\)
\(1560 = 900 + 30x + 50y \implies 30x + 50y = 660\)
\(3x + 5y = 66 .... (2)\)
Solving equation (1) and (2),
From (1), x = 14 - y
\(3(14 - y) + 5y = 42 - 3y + 5y = 66\)
\(2y = 24 \implies y = 12\)
\(x = 14 - y = 14 - 12 = 2\)
(x, y) = (2, 12).
(b)
| Class interval | Frequency | Upper class boundary |
| 1 - 10 | 1 | 10.5 |
| 11 - 20 | 1 | 20.5 |
| 21 - 30 | 2 | 30.5 |
| 31 - 40 | 5 | 40.5 |
| 41 - 50 | 12 | 50.5 |
| 51 - 60 | 1 | 60.5 |
| 61 - 70 | 4 | 70.5 |
| 71 - 80 | 3 | 80.5 |
| 81 - 90 | 1 | 90.5 |
(c) 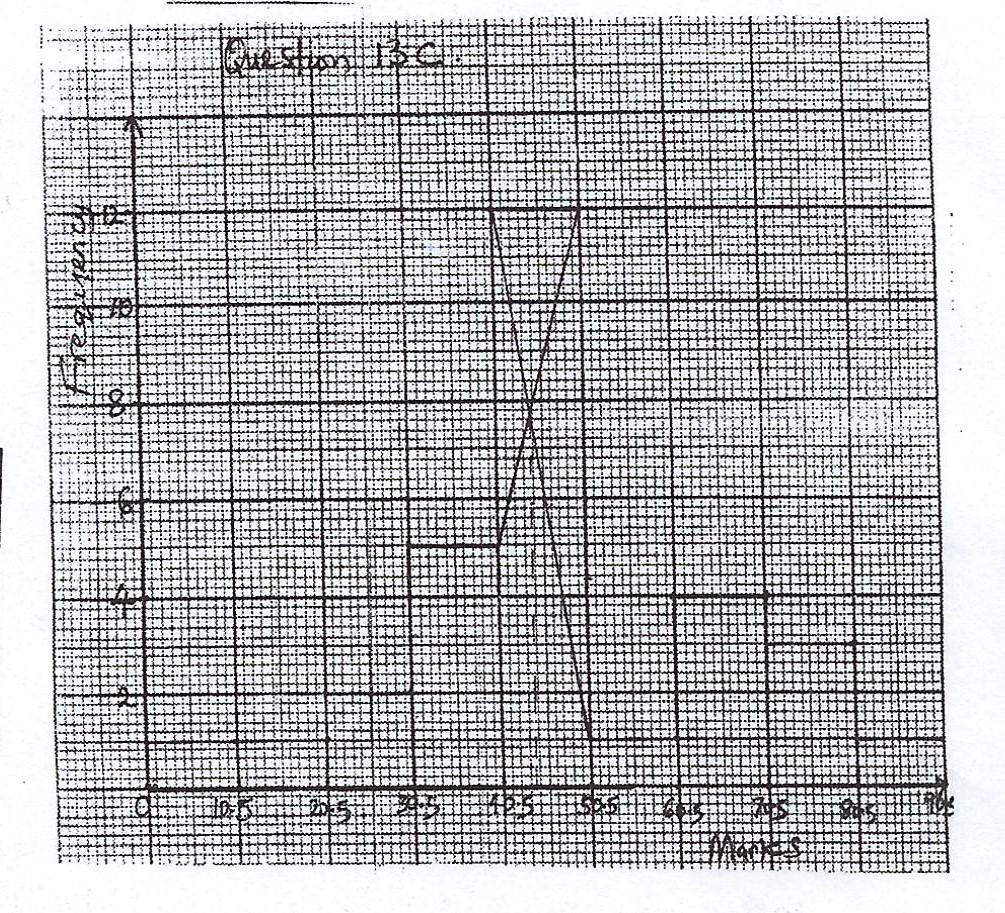
(d) From the histogram, Mode = 44.