
The table shows the distribution of sources obtained when a fair diwe was rolled 50 times.
| Score | 1 | 2 | 3 | 4 | 5 | 6 |
| Frequency | 2 | 5 | 13 | 11 | 9 | 10 |
1. Draw a bar chart for the distribution
2. Calculate the mean score of the distribution
Explanation
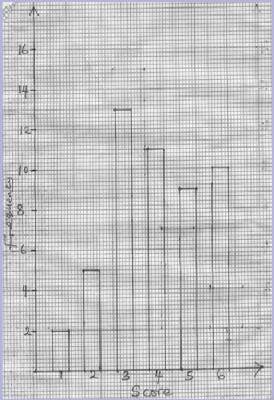
(a) The bar chart for the distribution is as shown
(b) They were able to construct the frequency distribution table as
| Score (x) | 1 | 2 | 3 | 4 | 5 | 6 | Total |
| Frequency (f) | 2 | 5 | 13 | 11 | 9 | 10 | 50 |
| fx | 2 | 10 | 39 | 44 | 45 | 60 | 200 |
Mean = \(\frac{200}{50}\) = 4