
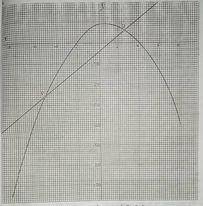
The graph shows the relation of the form y = mx\(^2\) + nx + r, where m, n and r are constants.
Using the graph:
(a) state the scale used on both axes; (b) find the values of m, n and r; (c) find the gradient of the line through P and Q; (d) state the range of values of x for which y > Q.
Explanation
(a) x-axis: 2 cm to 2 units or 1 cm to 1 unit
y-axis: 2 cm to 10 units or 1 cm to 5 units
(b) x = -2, x = 4
(x+2)(x-4) = 0
x\(^2\) -4x + 2x -8 = 0
x\(^2\) -2x - 8 = 0
y = 8 + 2x - x(curve has a max. point)
m = -1,n = 2, r =8
(c) P(-5,-27),Q(3,5)
Gradient = \(\frac{5+27}{3+5}\)
= \(\frac{32}{8}\)
= 4
(d) Range: {x:-2 < x < 4)