
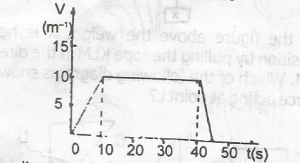
The diagram above shows a velocity time graph representing the motion of a car. Find the total distance covered during the acceleration and retardation of the motion
-
75m

- 150m
- 300m
- 375m
The correct answer is: A
Explanation
Distance during acceleration
= area of the first triangle = \(\frac{1}{2}\) x 10 x 10 = 50m
Distance during retardation( deceleration)
= area of second triangle = \(\frac{1}{2}\) x 5 x 10 = 25m
Total Distance = 50 + 25 = 75m.