
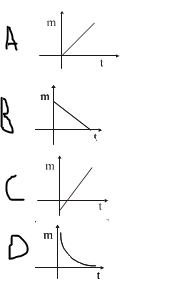
Which of the following graphs correctly represents the variation of mass of a given material deposited with time for constant current in Faraday’s Law of Electrolysis?
-
A

- B
- C
- D
The correct answer is: A
Explanation
According to Faraday's Law, the mass of the substance deposited is directly proportional to the time for which the current flows, assuming a constant current. Therefore, the graph should show a linear increase in mass over time, which corresponds to option A
There is an explanation video available .