(a) State three properties of waves
(b)(i) Describe, with the aid of a labelled diagram, an experiment to show how the frequency of the note emitted by a vibrating string depends on the tension in the string
(ii) State two precautions necessary to ensure accurate results.
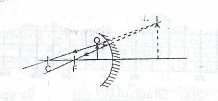
(c) Draw a ray diagram showing how a virtual image of an object is formed by a concave mirror.
Explanation
(a) Reflection, refraction, polarisation
= 3.86 9000 Win
(b)(i)
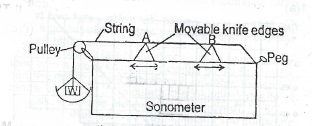
Method: Keep the distance AB constant and tight. Sound fork of known frequency F and pluck the string in the middle. Then add load to scale pan until resonance occurs. Record the load in the scale pan and the corresponding frequency. Repeat the experiment for about four tuning forks of known frequencies. Graph: Plot a graph of frequency, F against the square root of the load. Observation: The straight line graph passing through the origin shows that frequency is proportional to the square root of tension (load). F \(\alpha\) T
Precautions:
- Sonometer wire is firmly fixed.
- Strike the tuning fork on a pad
(c)