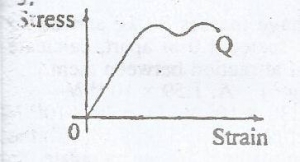
The diagram given, represents the graph of stress against strain for an elastic wire. The point Q on the graph is the
elastic linit
breaking point
yield point
proportional limit
The correct answer is: B
Explanation
No official explanation is available for this question at this time. Please check contributions posted by others below. If you can provide an explanation to help other student learn.