
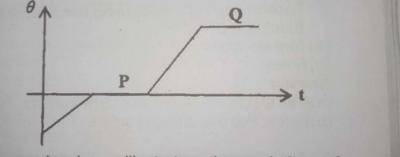

The graph above illustrates the variation of temperature \(\theta\) with time (t) for a solid that is being heated. Which processes take place at segments P and Q respectively?
- Freezing and vaporization
- Evaporation and solidification
-
Melting and boiling

- Condensation and evaporation
The correct answer is: C
Explanation
Since the substance is solid, it will need heat to melt to liquid and once the liquid starts boiling temperature will remain the same.