ANWSER
SECTION A
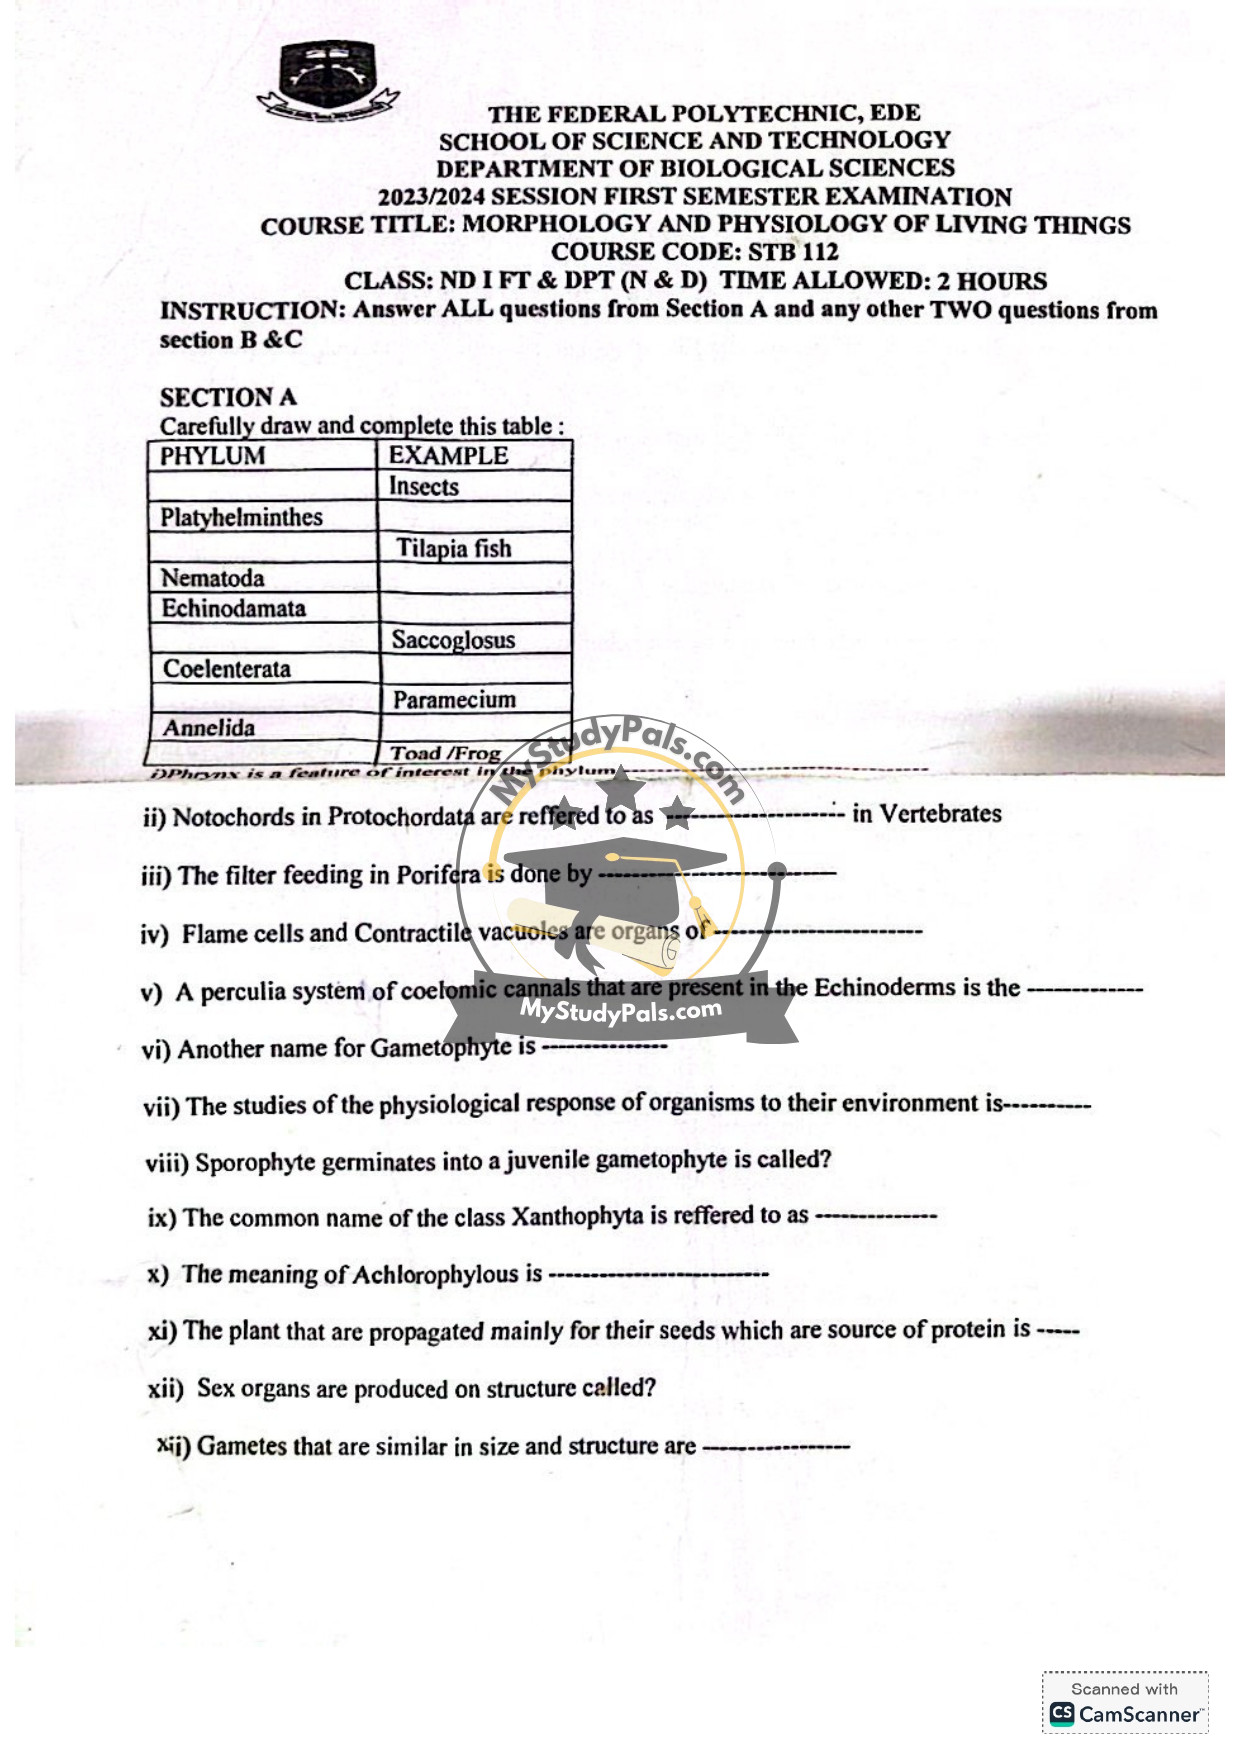
| PHYLUM | EXAMPLE |
|—————–|—————-|
| Arthropoda | Insects |
| Platyhelminthes | Tapeworm |
| Chordata | Tilapia fish |
| Nematoda | Ascaris |
| Echinodermata | Starfish |
| Hemichordata | Saccoglossus |
| Coelenterata | Hydra |
| Protozoa | Paramecium |
| Annelida | Earthworm |
i) Diplocaxis is a feature of interest in the phylum Chordata.
ii) Notochords in Protochordata are referred to as vertebral column in Vertebrates.
iii) The filter feeding in Porifera is done by choanocytes (collar cells).
iv) Flame cells and Contractile vacuoles are organs of osmoregulation and excretion.
v) A peculiar system of coelomic canals present in Echinoderms is the water vascular system.
vi) Another name for Gametophyte is haploid generation.
vii) The study of the physiological response of organisms to their environment is ecophysiology.
viii) Sporophyte germinates into a juvenile gametophyte called prothallus.
ix) The common name of the class Xanthophyta is referred to as yellow-green algae.
x) The meaning of Achlorophyllous is lacking chlorophyll.
xi) The plants propagated mainly for their seeds, which are a source of protein, are legumes (e.g., beans, peas).
xii) Sex organs are produced on structures called gametangia.
xiii) Gametes that are similar in size and structure are isogametes.
—
SECTION B
Question 1:
(a) (i) Statistics is the science of collecting, analyzing, interpreting, and presenting data. Two broad areas of statistics are:
– Descriptive Statistics
– Inferential Statistics
(ii) Four uses of Statistics:
– Summarizing and presenting data.
– Making informed decisions based on data analysis.
– Testing hypotheses in scientific research.
– Predicting future trends.
(b) (i) Five methods of collecting Statistical data:
– Surveys
– Experiments
– Observations
– Interviews
– Secondary data (e.g., records, reports)
(ii) Advantages and disadvantages of two methods:
– Surveys:
– *Advantages*: Quick data collection, large sample size.
– *Disadvantages*: Response bias, low response rate.
– Observations:
– *Advantages*: Direct data, no reliance on self-reporting.
– *Disadvantages*: Time-consuming, observer bias.
—
Question 2:
(a) (i) Qualitative data: Non-numerical (e.g., colors, opinions).
Quantitative data: Numerical (e.g., height, weight).
(ii) Population: Entire group being studied.
Sample: Subset of the population.
(iii) Probabilistic Techniques: Random selection (e.g., random sampling).
Non-probabilistic Techniques: Non-random selection (e.g., convenience sampling).
(iv) Location Classification: Data grouped by place (e.g., country, city).
Time Classification: Data grouped by time (e.g., years, months).
(b) Given:
– \( \epsilon = \{1,2,3,4,5\} \)
– \( A = \{1,3\} \)
– \( B = \{3,4\} \)
(i) \( A’ = \{2,4,5\} \)
(ii) \( B’ = \{1,2,5\} \)
(iii) \( A \cap B = \{3\} \)
(iv) \( A \cup B = \{1,3,4\} \)
(v) \( A \cap B’ = \{1\} \)
(vi) \( A \cup B’ = \{1,2,3,5\} \)
—
Question 3:
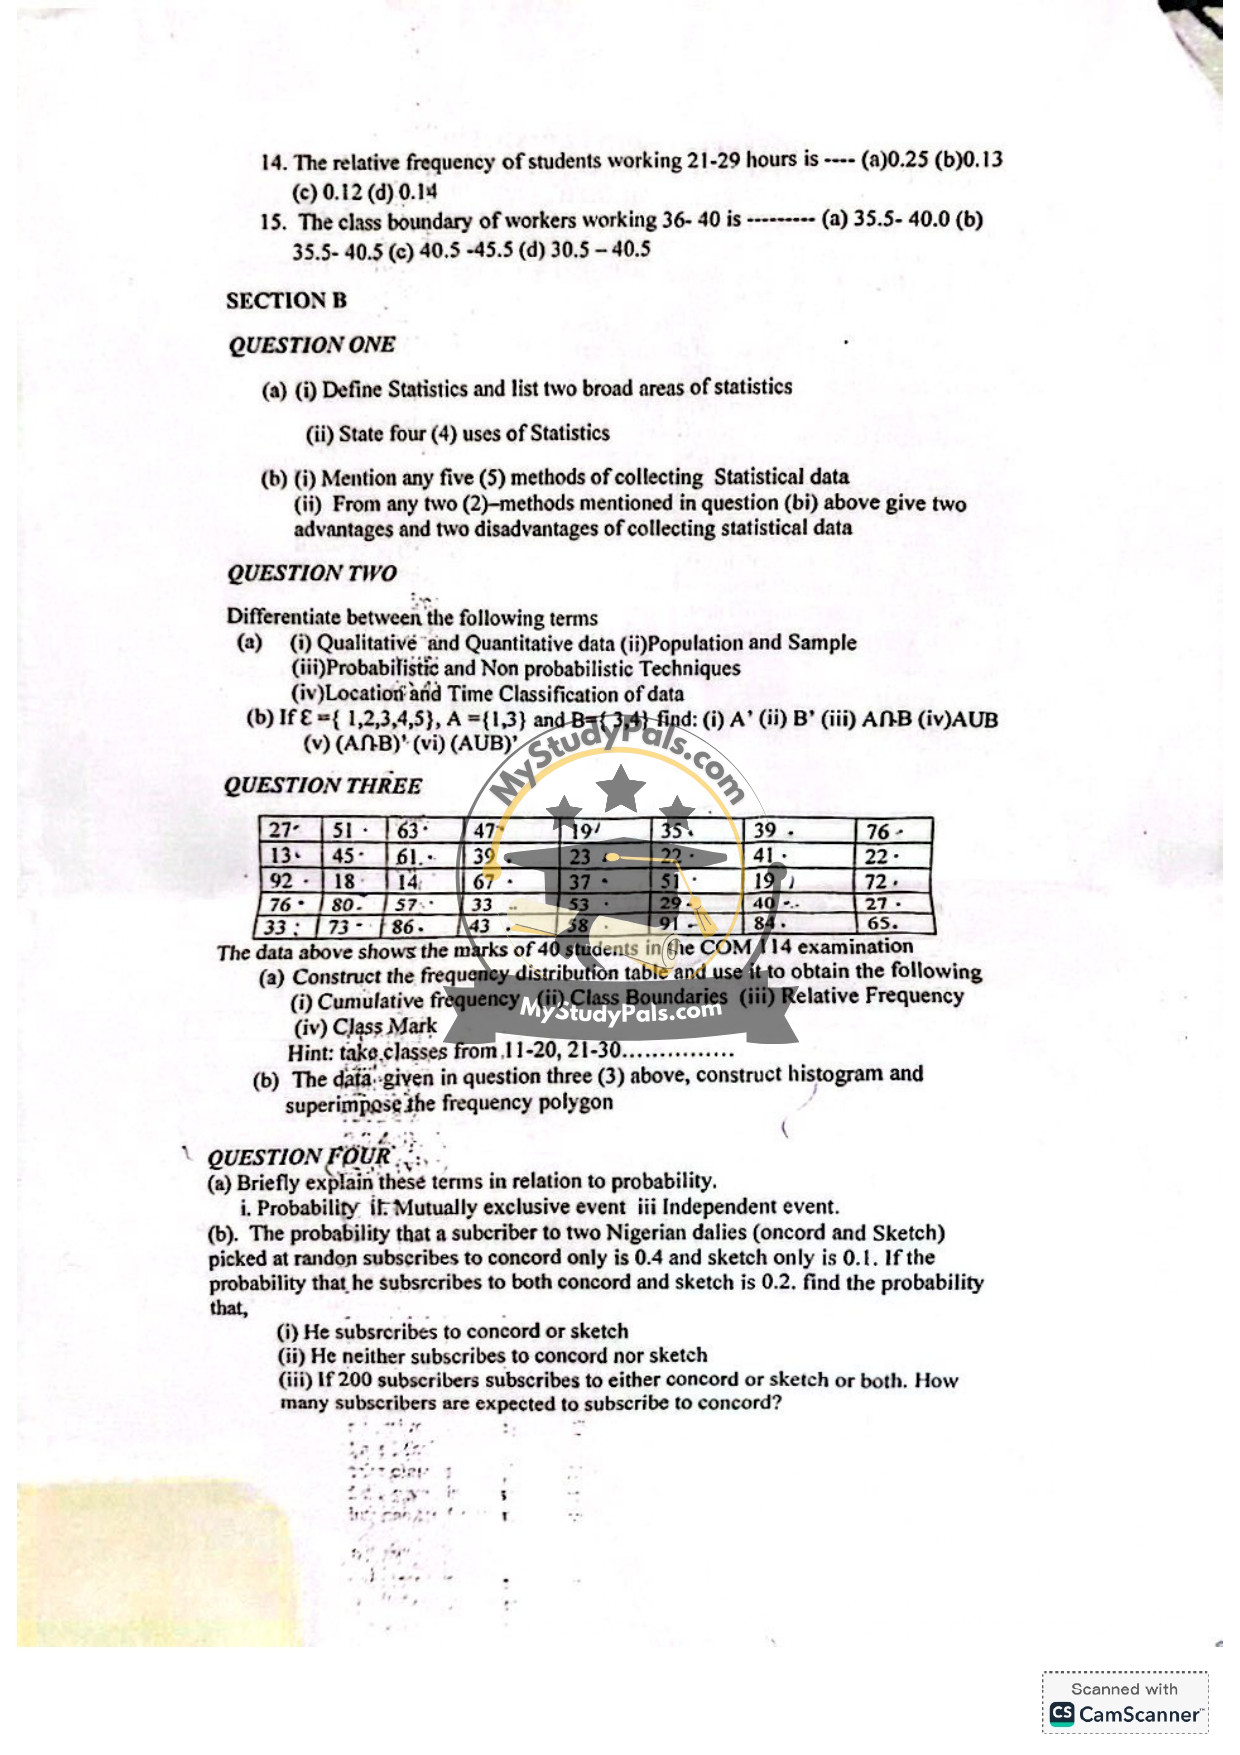
(a) Frequency Distribution Table:
| Class Interval | Frequency | Cumulative Frequency | Class Boundaries | Relative Frequency | Class Mark |
|—————-|———–|———————-|——————-|——————–|————|
| 11-20 | 5 | 5 | 10.5-20.5 | 0.125 | 15.5 |
| 21-30 | 7 | 12 | 20.5-30.5 | 0.175 | 25.5 |
| 31-40 | 8 | 20 | 30.5-40.5 | 0.200 | 35.5 |
| 41-50 | 6 | 26 | 40.5-50.5 | 0.150 | 45.5 |
| 51-60 | 5 | 31 | 50.5-60.5 | 0.125 | 55.5 |
| 61-70 | 4 | 35 | 60.5-70.5 | 0.100 | 65.5 |
| 71-80 | 3 | 38 | 70.5-80.5 | 0.075 | 75.5 |
| 81-90 | 1 | 39 | 80.5-90.5 | 0.025 | 85.5 |
| 91-100 | 1 | 40 | 90.5-100.5 | 0.025 | 95.5 |
(b) Histogram and Frequency Polygon:
*(Visual representation required; not possible in text format.)*
—
Question 4:
(a) (i) Probability: Likelihood of an event occurring, ranging from 0 (impossible) to 1 (certain).
(ii) Mutually Exclusive Events: Events that cannot occur simultaneously (e.g., rolling a die and getting a 1 or 6).
(iii) Independent Events: Events where the occurrence of one does not affect the other (e.g., flipping a coin twice).
(b) Given:
– P(Concord only) = 0.4
– P(Sketch only) = 0.1
– P(Both) = 0.2
(i) P(Concord or Sketch) = P(Concord only) + P(Sketch only) + P(Both) = 0.4 + 0.1 + 0.2 = 0.7
(ii) P(Neither) = 1 – P(Concord or Sketch) = 1 – 0.7 = 0.3
(iii) Expected subscribers to Concord = Total subscribers × P(Concord) = 200 × (0.4 + 0.2) = 120
—
SECTION C
Question 14:
The relative frequency of students working 21-29 hours is 0.14 (d).
Question 15:
The class boundary of workers working 36-40 is 35.5-40.5 (b).


