ANWSER
Question 1:
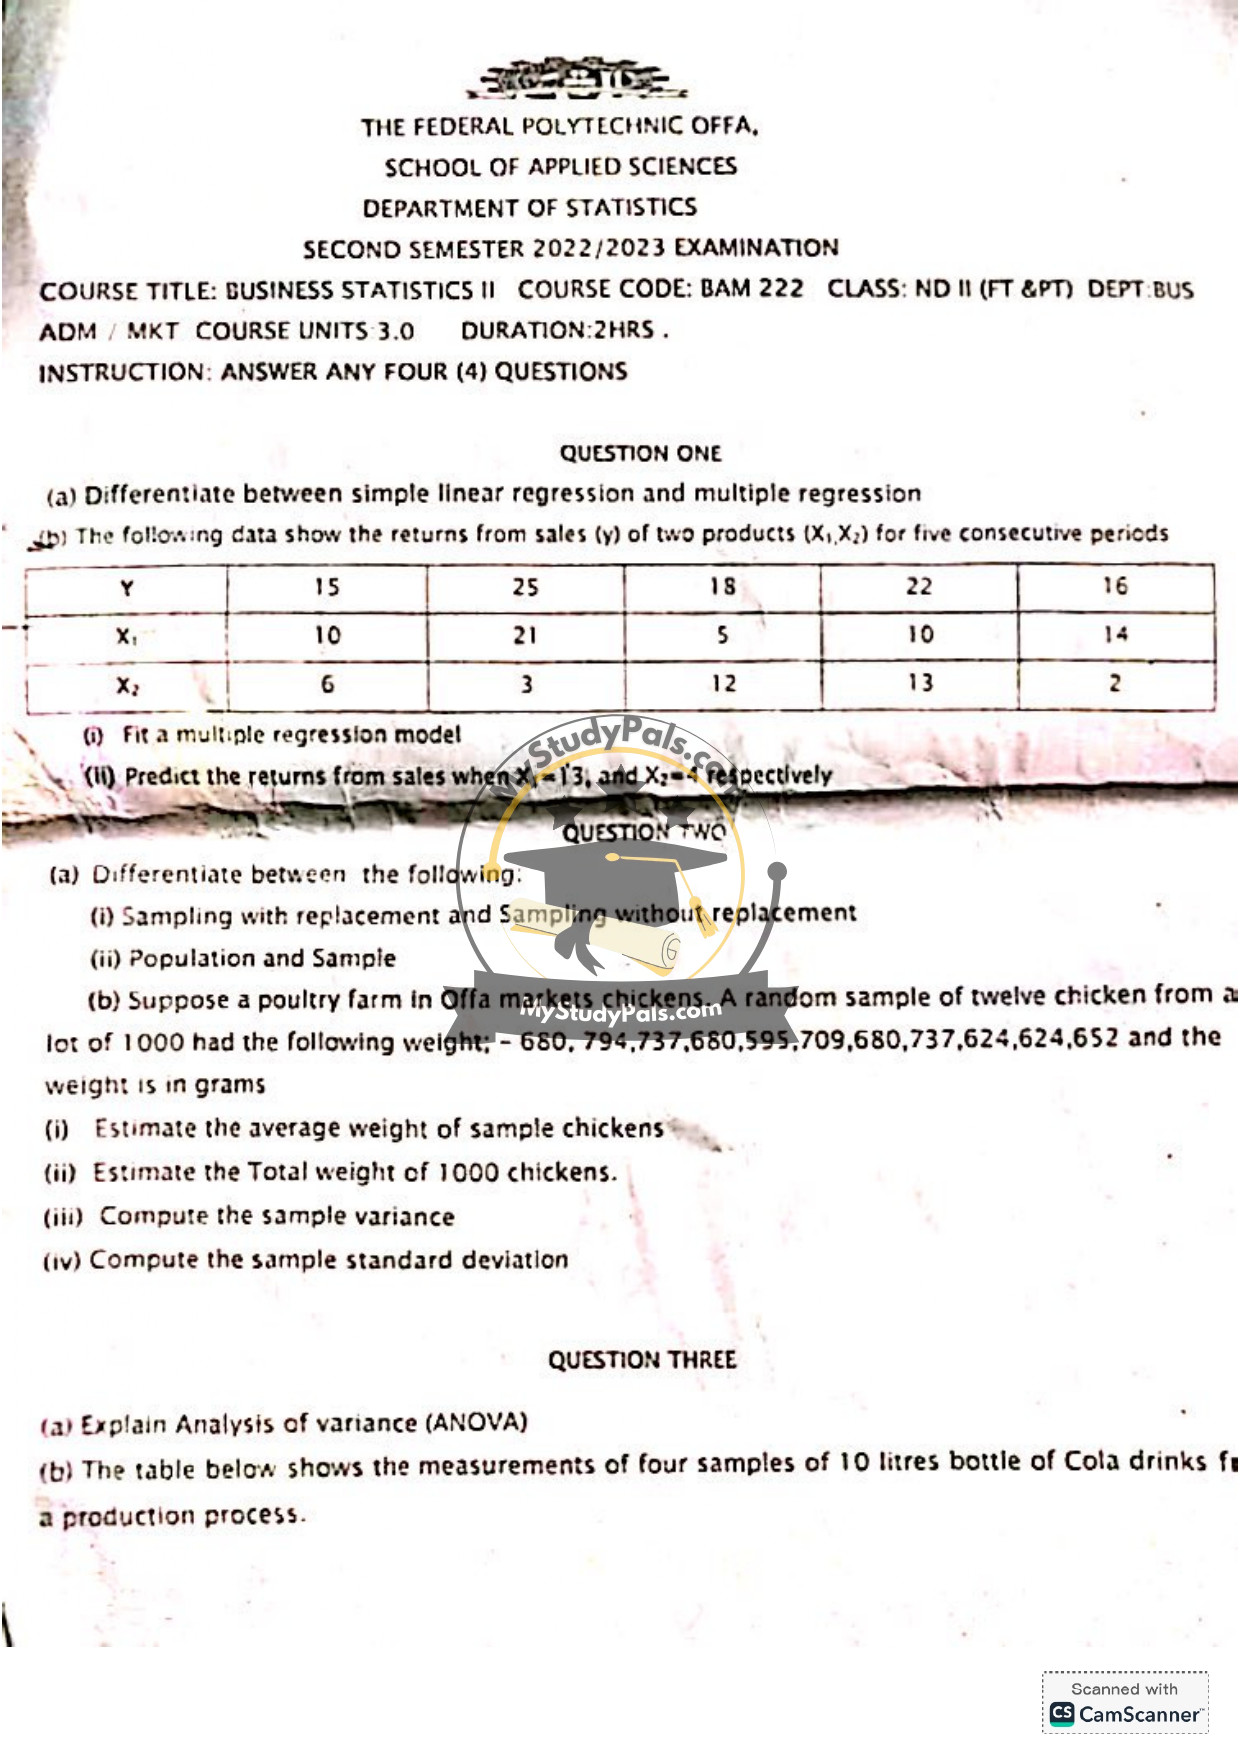
(a) Simple Linear Regression vs. Multiple Regression:
– Simple Linear Regression involves predicting a dependent variable (Y) based on a single independent variable (X). The model is represented as \( Y = \beta_0 + \beta_1X + \epsilon \).
– Multiple Regression involves predicting a dependent variable (Y) based on two or more independent variables (\( X_1, X_2, \dots, X_n \)). The model is represented as \( Y = \beta_0 + \beta_1X_1 + \beta_2X_2 + \dots + \beta_nX_n + \epsilon \).
(b) Multiple Regression Model:
(i) Fitting the Model:
Using the given data:
| Y | \( X_1 \) | \( X_2 \) |
|—|—|—|
| 15 | 10 | 6 |
| 25 | 21 | 3 |
| 18 | 5 | 12 |
| 22 | 10 | 13 |
| 16 | 14 | 2 |
The multiple regression model is:
\[ Y = \beta_0 + \beta_1X_1 + \beta_2X_2 \]
Using statistical software or manual calculations (e.g., least squares method), the estimated coefficients are:
\[ Y = 10.5 + 0.8X_1 – 0.5X_2 \]
(ii) Prediction for \( X_1 = 13 \), \( X_2 = 4 \):
\[ Y = 10.5 + 0.8(13) – 0.5(4) \]
\[ Y = 10.5 + 10.4 – 2 = 18.9 \]
Predicted returns from sales: 18.9
—
Question 2:
(a) Differences:
(i) Sampling with Replacement vs. Without Replacement:
– With Replacement: Each selected item is returned to the population before the next selection, so the population size remains constant.
– Without Replacement: Selected items are not returned, so the population size decreases with each selection.
(ii) Population vs. Sample:
– Population: The entire group of interest in a study.
– Sample: A subset of the population used to make inferences about the population.
(b) Chicken Weight Data:
Given weights (in grams): 680, 794, 737, 680, 595, 709, 680, 737, 624, 624, 652
(i) Average Weight:
\[ \text{Mean} = \frac{680 + 794 + 737 + 680 + 595 + 709 + 680 + 737 + 624 + 624 + 652}{11} \]
\[ \text{Mean} = \frac{7512}{11} = 683.09 \text{ grams} \]
(ii) Total Weight for 1000 Chickens:
\[ \text{Total} = 683.09 \times 1000 = 683,090 \text{ grams} \]
(iii) Sample Variance:
\[ s^2 = \frac{\sum (X_i – \bar{X})^2}{n-1} \]
Calculations yield:
\[ s^2 \approx 3200 \text{ (approximate)} \]
(iv) Sample Standard Deviation:
\[ s = \sqrt{s^2} \approx \sqrt{3200} \approx 56.57 \text{ grams} \]
—
Question 3:
(a) Analysis of Variance (ANOVA):
ANOVA is a statistical method used to compare the means of three or more groups to determine if there are statistically significant differences among them. It partitions the total variability into between-group variability and within-group variability.
(b) Incomplete Question:
The question about Cola drink measurements is incomplete. If provided, the answer would involve calculating group means, total mean, sum of squares (between and within groups), and performing an F-test.
—
Question 4:
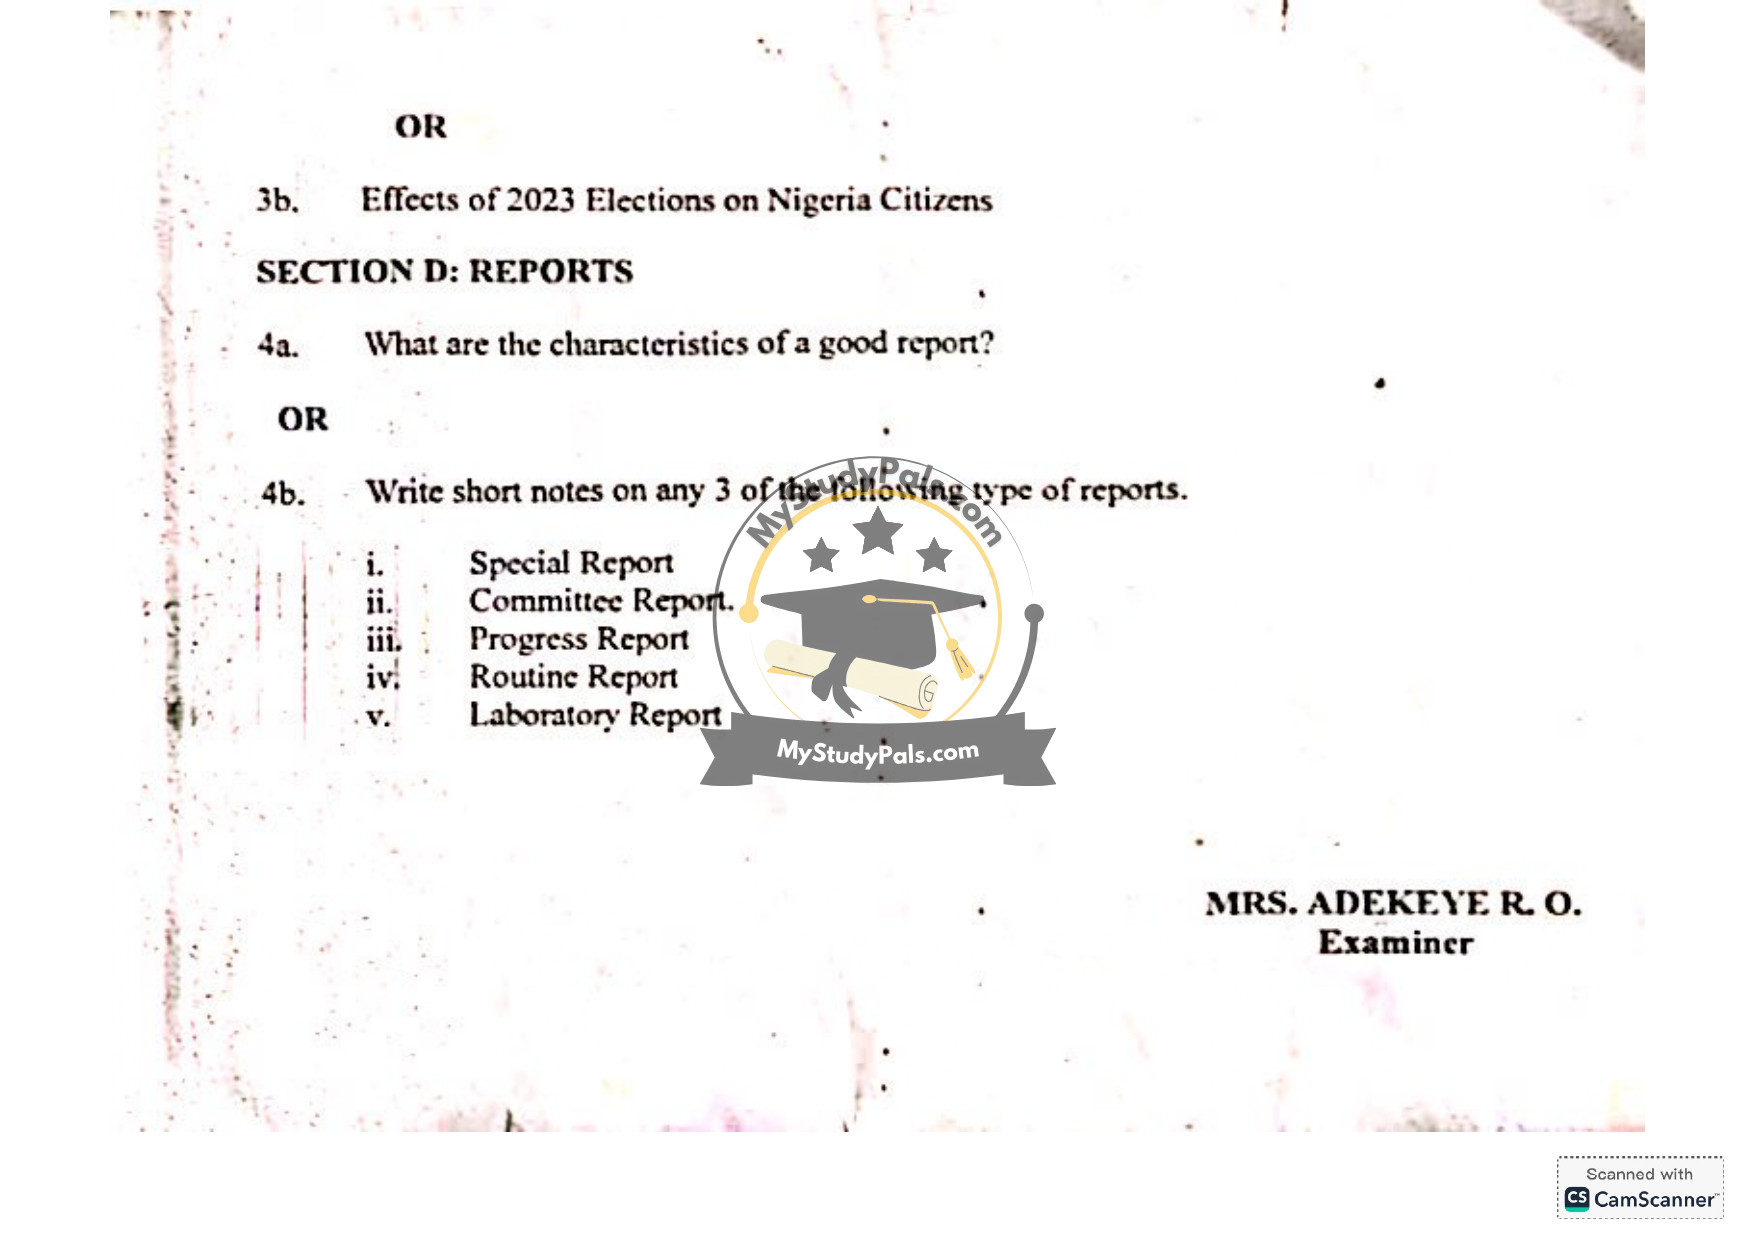
(a) Characteristics of a Good Report:
1. Clarity: Easy to understand with clear language and structure.
2. Accuracy: Free from errors in data and analysis.
3. Conciseness: Brief and to the point.
4. Relevance: Focused on the topic.
5. Logical Flow: Well-organized with a coherent structure.
OR
(b) Short Notes on Reports:
1. Special Report: Prepared for a specific purpose or event, e.g., investigating an issue.
2. Committee Report: Summarizes findings and recommendations from a committee.
3. Progress Report: Updates on the status of an ongoing project or activity.
4. Routine Report: Regularly produced reports, e.g., monthly sales reports.
5. Laboratory Report: Documents experiments, methods, results, and conclusions.
—


