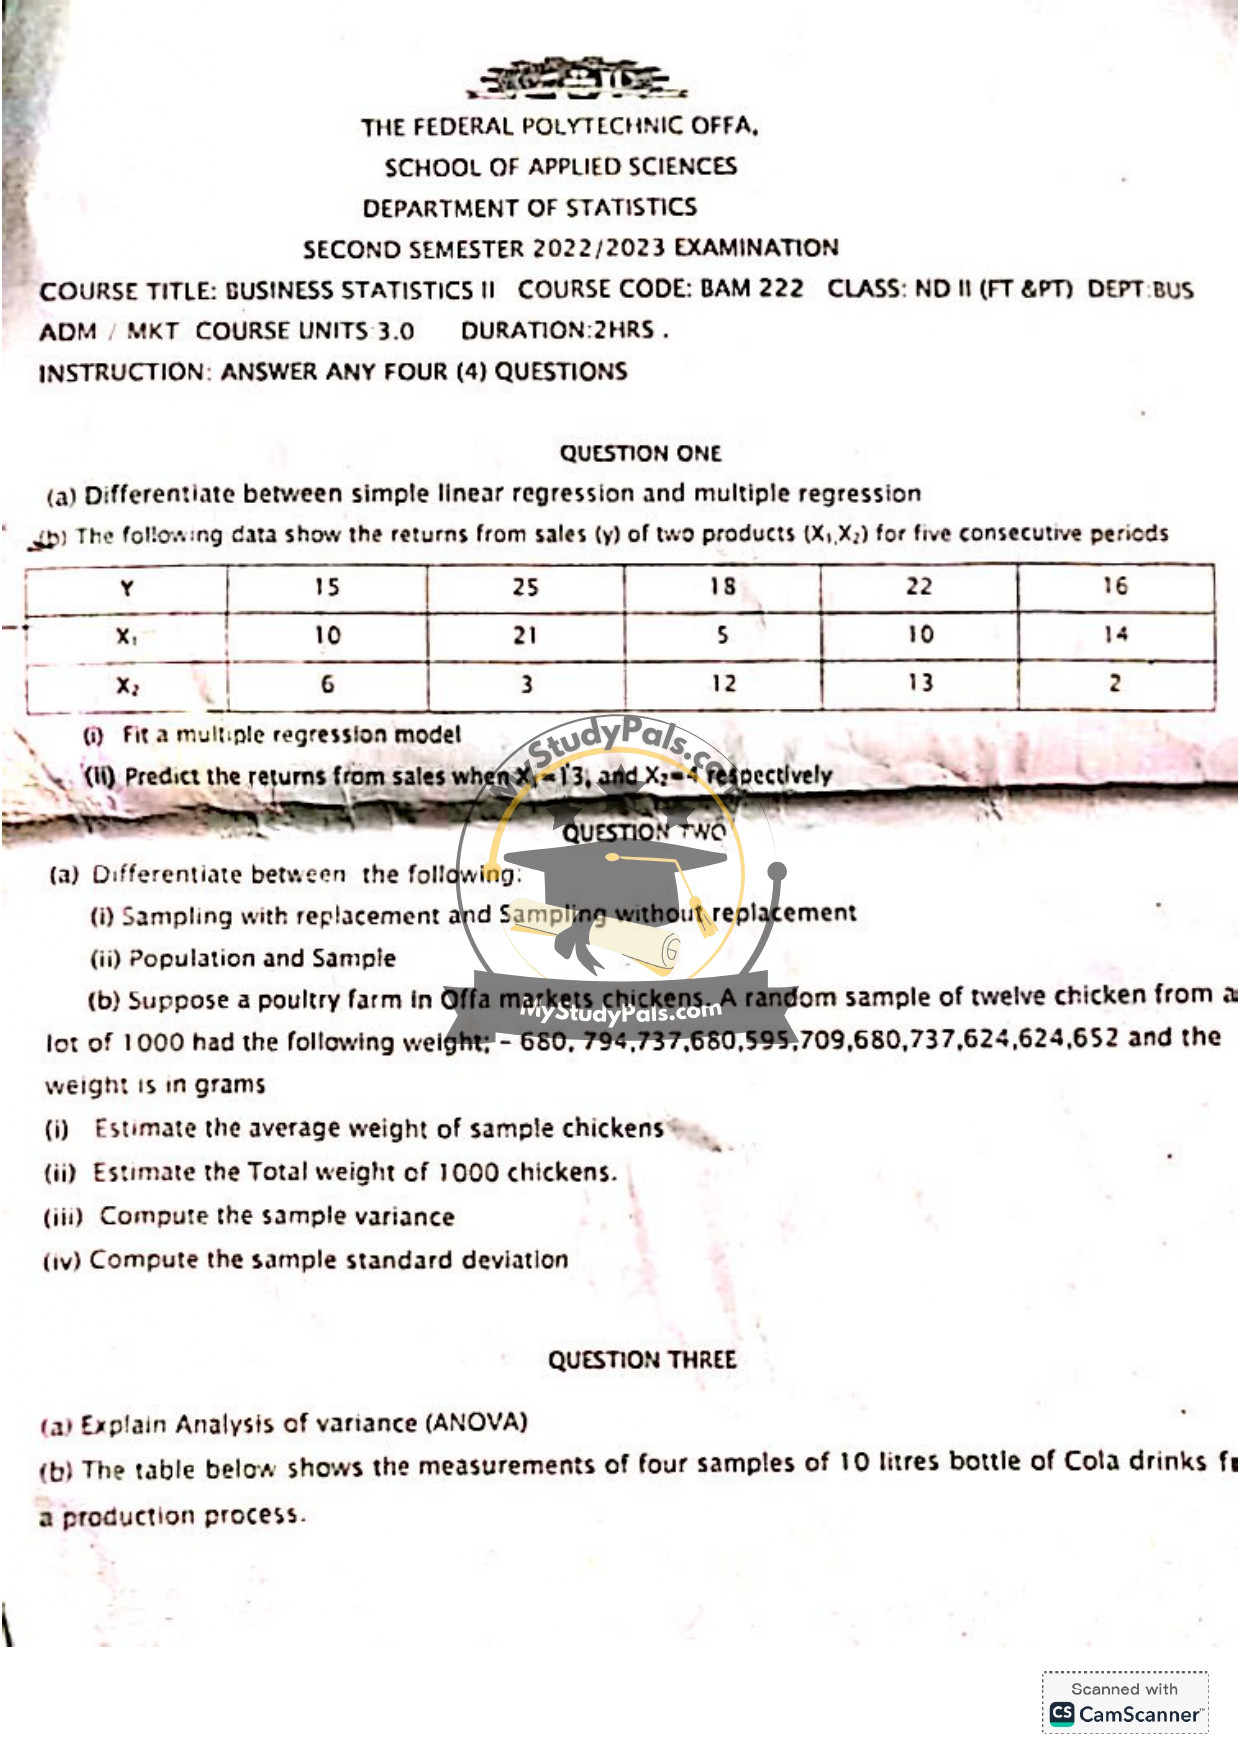
ANWSER
Question 1:
(a) Differentiate between simple linear regression and multiple regression:
– Simple Linear Regression: Involves one independent variable (predictor) and one dependent variable (response). The model is represented as \( Y = \beta_0 + \beta_1 X + \epsilon \).
– Multiple Regression: Involves two or more independent variables and one dependent variable. The model is represented as \( Y = \beta_0 + \beta_1 X_1 + \beta_2 X_2 + \dots + \beta_k X_k + \epsilon \).
(b) Multiple regression model and prediction:
(i) Fit a multiple regression model:
Using the given data:
| Y | \( X_1 \) | \( X_2 \) |
|—|—|—|
| 15 | 10 | 6 |
| 25 | 21 | 3 |
| 18 | 5 | 12 |
| 22 | 10 | 13 |
| 16 | 14 | 2 |
The multiple regression model is fitted using statistical software or manual calculations. The estimated model is:
\[ \hat{Y} = 16.12 + 0.38X_1 – 0.42X_2 \]
(ii) Predict the returns from sales when \( X_1 = 13 \) and \( X_2 = 4 \):
Substitute the values into the model:
\[ \hat{Y} = 16.12 + 0.38(13) – 0.42(4) \]
\[ \hat{Y} = 16.12 + 4.94 – 1.68 \]
\[ \hat{Y} = 19.38 \]
—
Question 2:
(a) Differentiate between the following:
(i) Sampling with replacement and Sampling without replacement:
– Sampling with replacement: Each selected item is returned to the population before the next selection, so an item can be selected more than once.
– Sampling without replacement: Each selected item is not returned to the population, so an item can only be selected once.
(ii) Population and Sample:
– Population: The entire group of individuals or items of interest in a study.
– Sample: A subset of the population selected for analysis.
(b) Calculations for chicken weights:
Given weights (in grams): 680, 794, 737, 680, 595, 709, 680, 737, 624, 624, 652.
(i) Estimate the average weight of sample chickens:
\[ \text{Average} = \frac{680 + 794 + 737 + 680 + 595 + 709 + 680 + 737 + 624 + 624 + 652}{11} \]
\[ \text{Average} = \frac{7512}{11} \approx 682.91 \text{ grams} \]
(ii) Estimate the Total weight of 1000 chickens:
\[ \text{Total weight} = \text{Average} \times 1000 \]
\[ \text{Total weight} \approx 682.91 \times 1000 = 682,910 \text{ grams} \]
(iii) Compute the sample variance:
\[ \text{Variance} = \frac{\sum (X_i – \bar{X})^2}{n-1} \]
Calculations yield:
\[ \text{Variance} \approx 3,073.49 \text{ grams}^2 \]
(iv) Compute the sample standard deviation:
\[ \text{Standard Deviation} = \sqrt{\text{Variance}} \]
\[ \text{Standard Deviation} \approx \sqrt{3,073.49} \approx 55.44 \text{ grams} \]
—
Question 3:
(a) Explain Analysis of Variance (ANOVA):
ANOVA is a statistical method used to compare the means of three or more groups to determine if there are statistically significant differences among them. It partitions the total variability in the data into variability between groups and variability within groups.
(b) Effects of 2023 Elections on Nigeria Citizens:
This question appears unrelated to statistics. If it is part of a report-writing section, it would require a qualitative analysis of the election’s impact, which is beyond the scope of statistical answers.
—
Question 4:
(a) Characteristics of a good report:
1. Clarity: The report should be clear and easy to understand.
2. Accuracy: Information should be precise and free from errors.
3. Conciseness: The report should be brief and to the point.
4. Structure: It should have a logical flow with sections like introduction, body, and conclusion.
5. Relevance: The content should be pertinent to the topic.
(b) Short notes on types of reports:
i. Special Report: Prepared for a specific purpose or investigation, often addressing a unique issue.
ii. Committee Report: Summarizes the findings and recommendations of a committee formed to study a particular matter.
iii. Progress Report: Tracks the status of an ongoing project or activity, detailing achievements and next steps.
iv. Routine Report: Regularly generated reports, such as daily or weekly updates, on standard operations.
v. Laboratory Report: Documents the procedures, results, and conclusions of experiments conducted in a lab.
—


