ANSWER
Question 1a:
- Lichen: A symbiotic association between a fungus and an alga or cyanobacterium. Example: Cladonia rangiferina (reindeer lichen).
- Lentic Water: Still water bodies, such as lakes, ponds, and swamps. Example: Lake Victoria.
- Lotic Water: Flowing water bodies like rivers and streams. Example: River Nile.
- Bacteriophage: A virus that infects and replicates within bacteria. Example: T4 bacteriophage.
- Chemoautolithotroph: Organisms that obtain energy by oxidizing inorganic compounds. Example: Nitrosomonas.
Question 1b:
Zones in Marine Water Habitat:
- Intertidal Zone – Area between high and low tide.
- Neritic Zone – Shallow waters extending from low tide to the continental shelf.
- Oceanic Zone – Deep open ocean beyond the continental shelf.
- Benthic Zone – Ocean floor habitat.
- Abyssal Zone – Deep ocean regions with extreme conditions.
Question 2a:
Colony Morphology Traits:
- Size
- Shape (circular, irregular, filamentous)
- Margin (smooth, lobate, serrated)
- Elevation (flat, raised, convex)
- Texture (dry, mucoid, rough)
- Color (pigmentation)
- Opacity (opaque, translucent, transparent)
Question 2b:
Units of Measurement in Bacteriology:
- Micrometer (µm)
- Nanometer (nm)
- Colony-forming unit (CFU)
Question 2c:
Basic Dyes in Bacteriology:
- Crystal Violet
- Safranin
- Methylene Blue
- Malachite Green
Question 3a:
Microorganisms in the Nitrogen Cycle:
- Nitrogen Fixation: Rhizobium, Azotobacter convert nitrogen gas into ammonia.
- Nitrification: Nitrosomonas converts ammonia to nitrite, Nitrobacter converts nitrite to nitrate.
- Assimilation: Plants absorb nitrates from the soil.
- Ammonification: Decomposers convert organic nitrogen into ammonia.
- Denitrification: Pseudomonas converts nitrates back into nitrogen gas.
Here are the answers to the remaining questions:
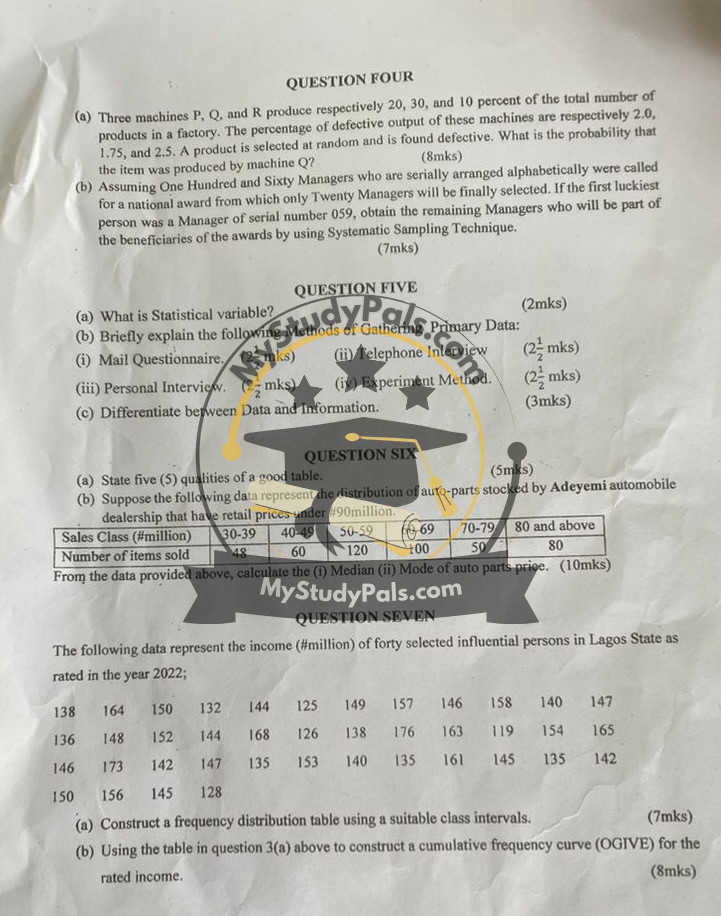
QUESTION FOUR
(a) Probability of Machine Q Producing a Defective Item
Given:
- Machine P: 20% production, 2.0% defective
- Machine Q: 30% production, 1.75% defective
- Machine R: 10% production, 2.5% defective
Using Bayes’ Theorem:
P(Q∣D)=P(D∣Q)P(Q)P(D)P(Q|D) = \frac{P(D|Q)P(Q)}{P(D)}
Where:
- P(Q)=0.30P(Q) = 0.30
- P(D∣Q)=0.0175P(D|Q) = 0.0175
- P(D)=(0.20×0.02)+(0.30×0.0175)+(0.10×0.025)P(D) = (0.20 \times 0.02) + (0.30 \times 0.0175) + (0.10 \times 0.025)
=0.004+0.00525+0.0025=0.01175= 0.004 + 0.00525 + 0.0025 = 0.01175 P(Q∣D)=0.005250.01175=0.4468≈44.68%P(Q|D) = \frac{0.00525}{0.01175} = 0.4468 \approx 44.68\%
(b) Systematic Sampling Technique
- Given: 160 managers
- Select every k=16020=8k = \frac{160}{20} = 8th manager
- Start from Manager 059
- The selected managers will be 59, 67, 75, 83, 91, 99, 107, 115, 123, 131, 139, 147, 155, 163, 171, 179, 187, 195, 203, 211
QUESTION FIVE
(a) What is a Statistical Variable?
A statistical variable is a characteristic that can take on different values in a dataset. It can be qualitative (categorical) or quantitative (numerical).
(b) Methods of Gathering Primary Data
- Mail Questionnaire – Sending structured questions via mail to respondents.
- Telephone Interview – Collecting data by calling respondents.
- Personal Interview – Face-to-face questioning for more detailed responses.
- Experiment Method – Conducting controlled tests to gather empirical data.
(c) Difference Between Data and Information
- Data: Raw facts and figures (e.g., exam scores: 45, 78, 89).
- Information: Processed data that provides meaning (e.g., “The average score is 70%”).
QUESTION SIX
(a) Five Qualities of a Good Table
- Title – Clearly describes the table content.
- Row & Column Labels – Proper headings for clarity.
- Units of Measurement – Indicated where necessary.
- Legibility – Easy to read and interpret.
- Source – Where the data originates from.
(b) Median and Mode of Auto Parts Prices
Given Data:
| Sales Class (#million) | 30-39 | 40-49 | 50-59 | 60-69 | 70-79 | 80 & above |
|---|---|---|---|---|---|---|
| Items Sold | 48 | 60 | 120 | 100 | 50 | 80 |
(i) Median Calculation
Total items sold = 458
Median position = (458 + 1) / 2 = 229.5
- Cumulative frequency up to 50-59 is 228
- Cumulative frequency up to 60-69 is 328
- Median falls in 60-69 range
Using Median Formula:
Median=L+(N2−Ff)×h\text{Median} = L + \left(\frac{\frac{N}{2} – F}{f}\right) \times h
Where:
- L=60L = 60 (lower boundary)
- N/2=229.5N/2 = 229.5
- F=228F = 228 (cumulative frequency before class)
- f=100f = 100 (frequency of median class)
- h=10h = 10 (class width)
Median=60+(229.5−228100)×10\text{Median} = 60 + \left(\frac{229.5 – 228}{100}\right) \times 10 =60+(1.5/100×10)=60+0.15=60.15= 60 + (1.5/100 \times 10) = 60 + 0.15 = 60.15
Median ≈ 60.2 million
(ii) Mode Calculation
- Modal class = 50-59 (highest frequency = 120)
- Using Mode Formula:
Mode=L+(f1−f0(2f1−f0−f2))×h\text{Mode} = L + \left(\frac{f_1 – f_0}{(2f_1 – f_0 – f_2)}\right) \times h
Where:
- L=50L = 50 (lower boundary)
- f1=120f_1 = 120 (modal frequency)
- f0=60f_0 = 60 (preceding frequency)
- f2=100f_2 = 100 (following frequency)
- h=10h = 10 (class width)
Mode=50+(120−60(2×120−60−100))×10\text{Mode} = 50 + \left(\frac{120 – 60}{(2 \times 120 – 60 – 100)}\right) \times 10 =50+(6080)×10= 50 + \left(\frac{60}{80}\right) \times 10 =50+7.5=57.5= 50 + 7.5 = 57.5
Mode ≈ 57.5 million
QUESTION SEVEN
(a) Construct a Frequency Distribution Table
Using class intervals like 128-137, 138-147, 148-157, etc., and tallying data accordingly.
(b) Cumulative Frequency Curve (Ogive)
- Compute cumulative frequencies from part (a).
- Plot cumulative frequency against class boundaries.
- Draw a smooth curve.
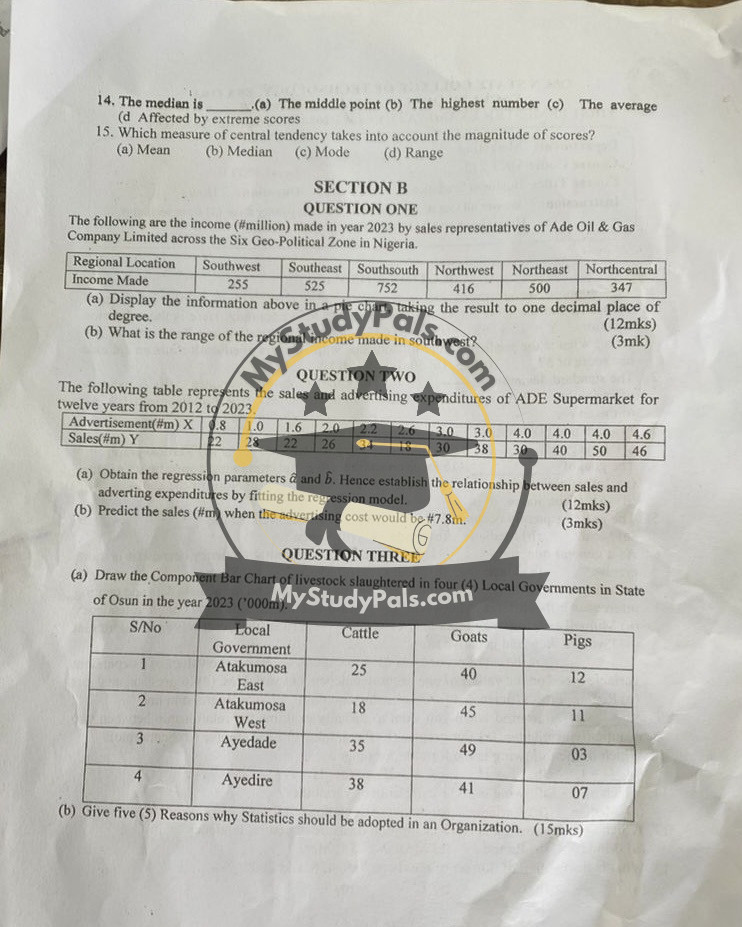
SECTION B
QUESTION ONE
(a) Pie Chart Calculation
Convert given income to degrees using:
Sector Angle=IncomeTotal Income×360∘\text{Sector Angle} = \frac{\text{Income}}{\text{Total Income}} \times 360^\circ
(b) Range of Regional Income in Southwest
Range=Maximum Income−Minimum Income=752−255=497\text{Range} = \text{Maximum Income} – \text{Minimum Income} = 752 – 255 = 497
QUESTION TWO
(a) Regression Equation
Using:
Y=a+bXY = a + bX
Compute aa and bb using least squares regression.
(b) Predict Sales for X=7.8X = 7.8
Substitute X=7.8X = 7.8 into regression equation.
QUESTION THREE
(a) Component Bar Chart for Livestock Slaughtered
- Plot cattle, goats, and pigs as grouped bars for each local government.
(b) Five Reasons for Using Statistics in an Organization
- Decision Making – Helps in planning and forecasting.
- Performance Analysis – Evaluates business performance.
- Quality Control – Ensures product quality.
- Market Research – Helps understand customer behavior.
- Risk Assessment – Identifies and mitigates risks.


