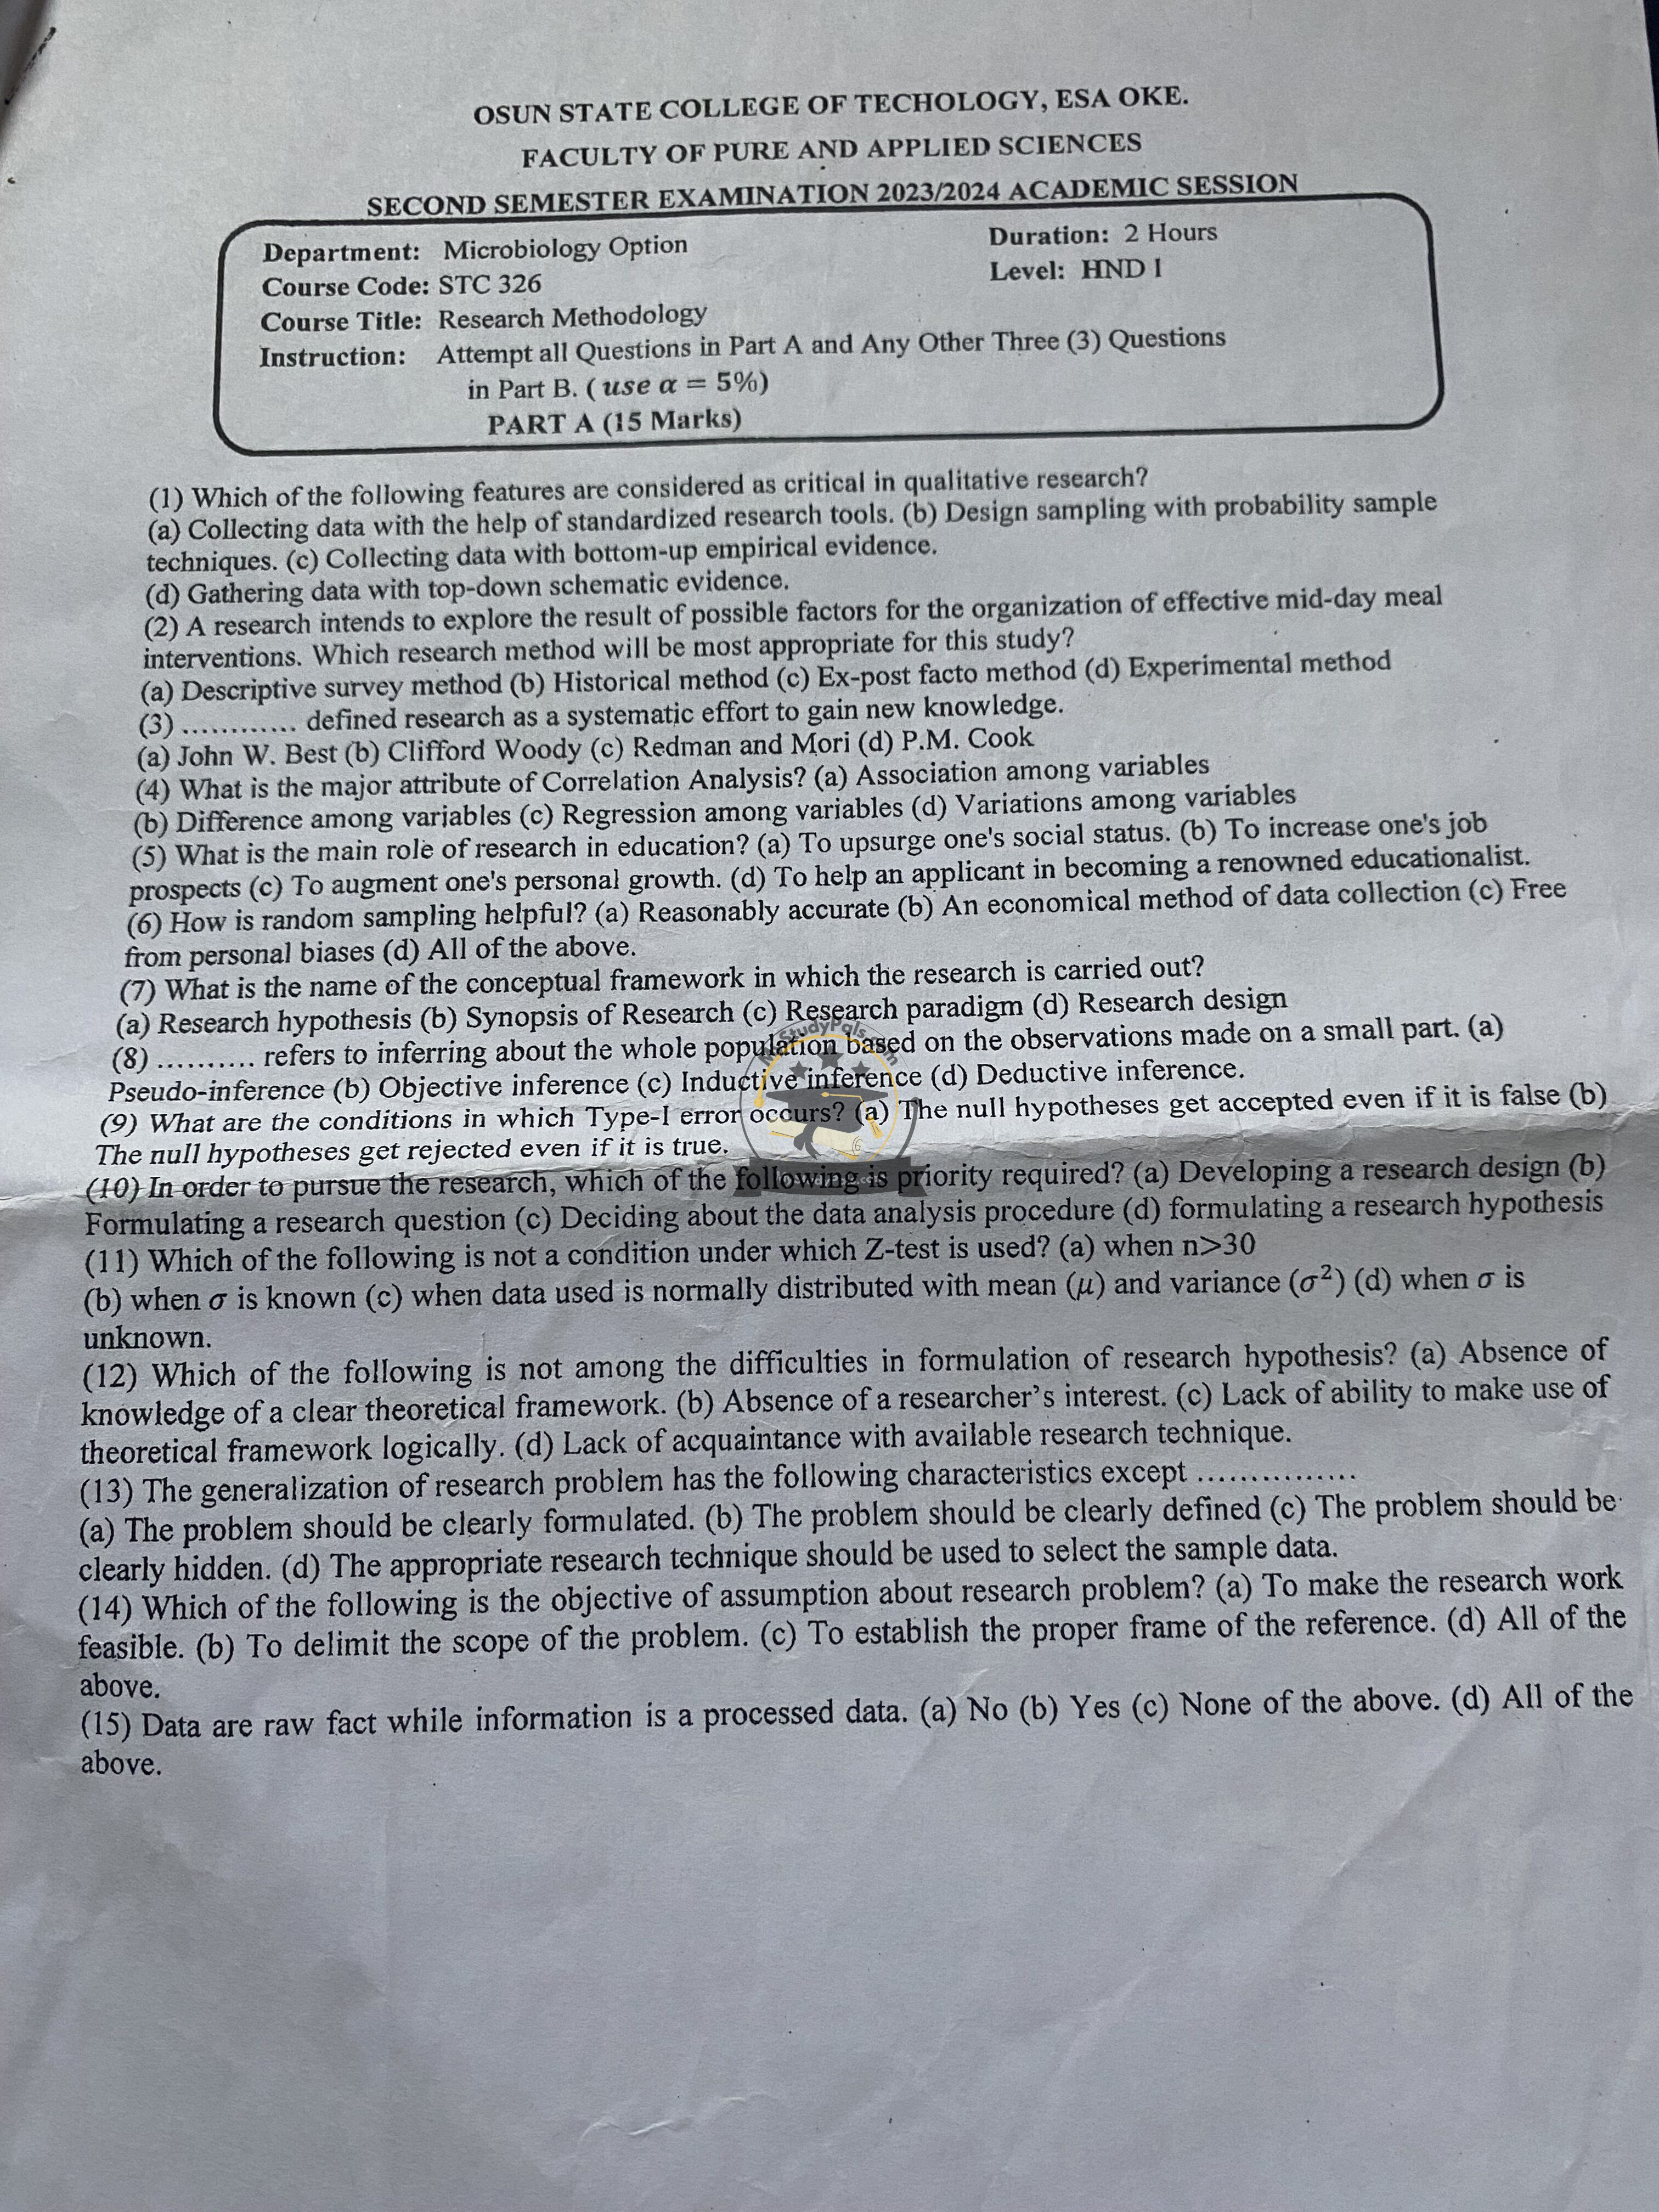
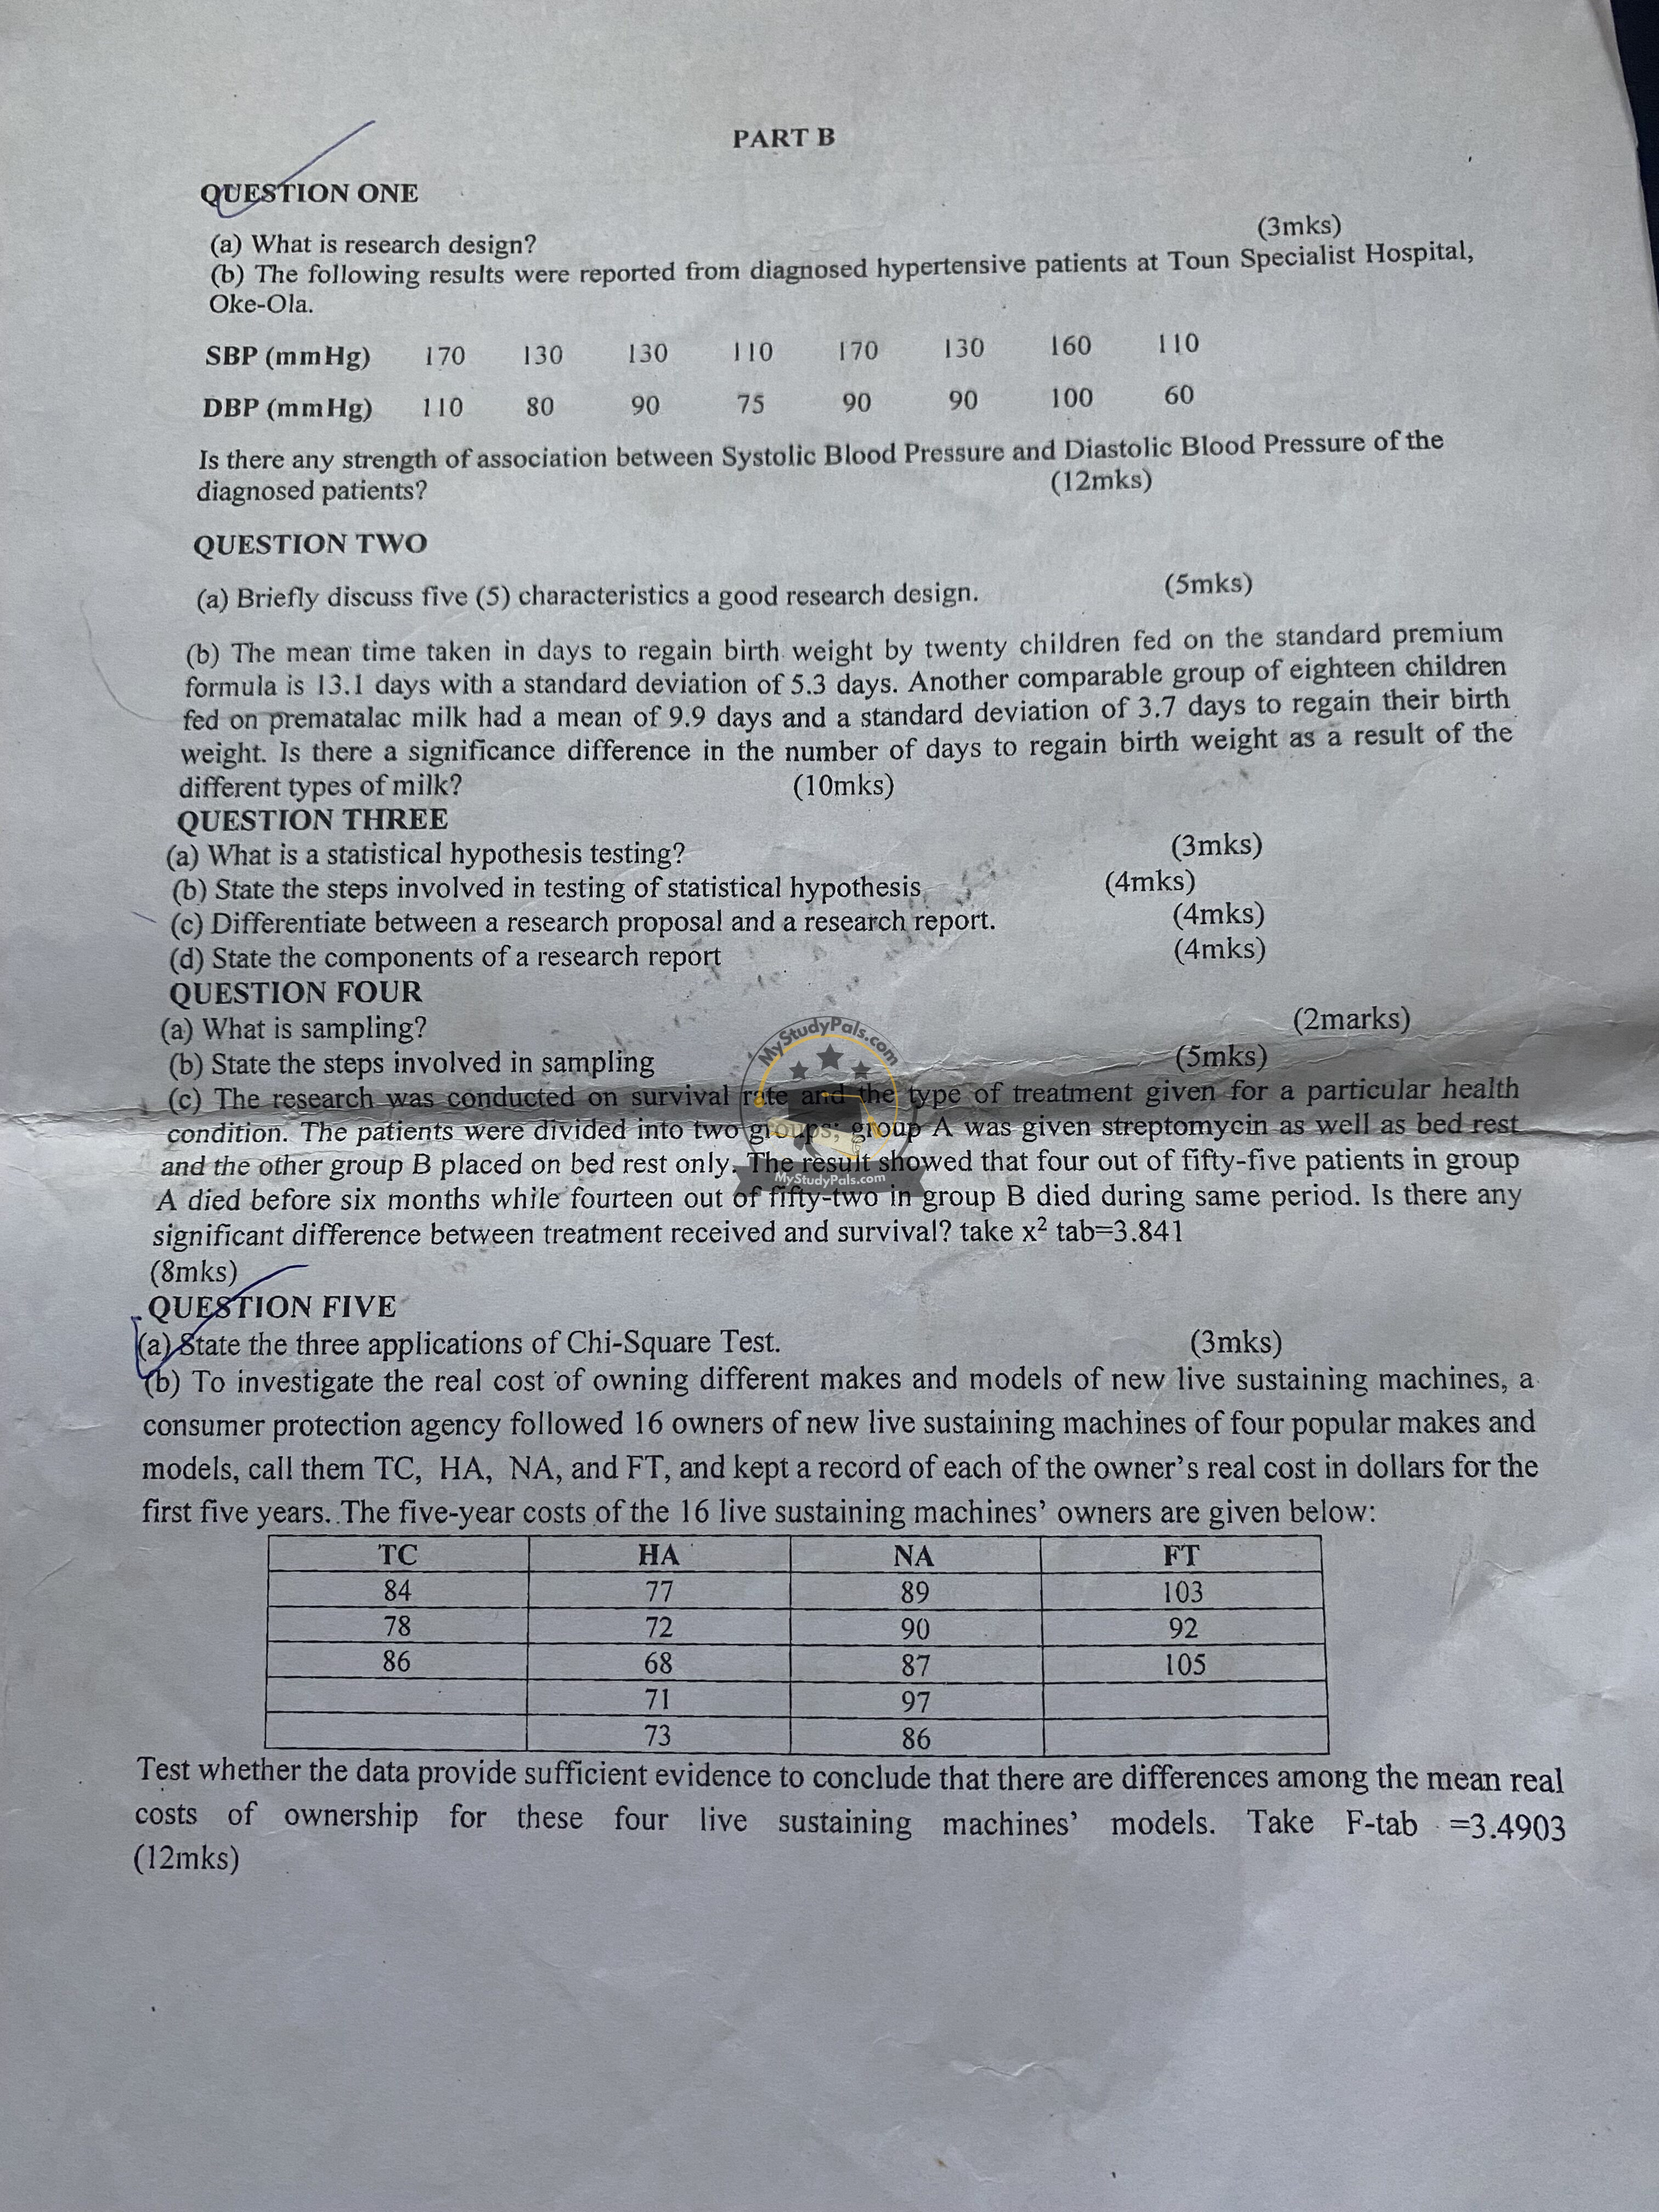
ANWSER
—
PART A
Question 1:
Answer: (c) Collecting data with bottom-up data.
Question 2:
Answer: (a) Descriptive survey method.
Question 3:
Answer: (a) Associating among various variables.
Question 4:
Answer: (a) To help an applicant in becoming a renowned educationalist.
Question 5:
Answer: (d) All of the above.
Question 6:
Answer: (c) Research paradigm.
Question 7:
Answer: (c) Inductive inference.
Question 8:
Answer: (I) The null hypotheses get accepted even if it is false.
Question 9:
Answer: (b) Formulating a research question.
Question 10:
Answer: (d) when σ is unknown.
Question 11:
Answer: (b) Absence of a researcher’s interest.
Question 12:
Answer: (c) The problem should be clearly hidden.
Question 13:
Answer: (d) All of the above.
Question 14:
Answer: (b) Yes.
—
PART B
QUESTION ONE
(a)
Answer: Research design is a framework or blueprint for conducting a research project. It outlines the methods and procedures for collecting, analyzing, and interpreting data to address the research problem.
(b)
Answer: To determine the strength of association between Systolic Blood Pressure (SBP) and Diastolic Blood Pressure (DBP), calculate the Pearson correlation coefficient (r). The steps are as follows:
1. Calculate the mean of SBP and DBP.
2. Compute the deviations from the mean for both variables.
3. Multiply the deviations for each pair and sum them up.
4. Calculate the standard deviations of SBP and DBP.
5. Use the formula for Pearson’s r:
\[
r = \frac{\sum{(X – \bar{X})(Y – \bar{Y})}}{\sqrt{\sum{(X – \bar{X})^2} \sum{(Y – \bar{Y})^2}}}
\]
After performing the calculations, the correlation coefficient (r) will indicate the strength and direction of the association.
—
QUESTION TWO
(a)
Answer: Five characteristics of a good research design are:
1. Clear Objectives: The research design should align with the study’s goals.
2. Reliability: It should produce consistent results under similar conditions.
3. Validity: It should accurately measure what it intends to measure.
4. Flexibility: It should allow for adjustments if needed.
5. Feasibility: It should be practical given the available resources and time.
(b)
Answer: To test for a significant difference in the mean days to regain birth weight between the two groups, perform an independent samples t-test. The steps are:
1. State the null hypothesis (H₀: μ₁ = μ₂) and alternative hypothesis (H₁: μ₁ ≠ μ₂).
2. Calculate the pooled standard deviation.
3. Compute the t-statistic using the formula:
\[
t = \frac{\bar{X}_1 – \bar{X}_2}{\sqrt{\frac{s_1^2}{n_1} + \frac{s_2^2}{n_2}}}
\]
4. Compare the calculated t-value with the critical t-value at the chosen significance level (e.g., α = 0.05).
5. If the calculated t-value exceeds the critical value, reject H₀, indicating a significant difference.
—
QUESTION THREE
(a)
Answer: Statistical hypothesis testing is a method used to make inferences about a population based on sample data. It involves testing assumptions (hypotheses) about population parameters.
(b)
Answer: The steps in hypothesis testing are:
1. State the null (H₀) and alternative (H₁) hypotheses.
2. Choose a significance level (α).
3. Select the appropriate test and compute the test statistic.
4. Determine the critical value or p-value.
5. Compare the test statistic with the critical value or evaluate the p-value.
6. Make a decision to reject or fail to reject H₀.
(c)
Answer:
– Research Proposal: A plan outlining the research objectives, methodology, and significance before the study begins.
– Research Report: A detailed document presenting the findings, analysis, and conclusions after the study is completed.
(d)
Answer: Components of a research report include:
1. Title
2. Abstract
3. Introduction
4. Literature Review
5. Methodology
6. Results
7. Discussion
8. Conclusion
9. References
—
QUESTION FIVE
(a)
Answer: Three applications of the Chi-Square Test are:
1. Testing independence between categorical variables.
2. Testing goodness-of-fit for observed vs. expected frequencies.
3. Comparing proportions in different groups.
(b)
Answer: To test for differences among the mean real costs of ownership for the four models (TC, HA, NA, FT), perform a one-way ANOVA. The steps are:
1. State the hypotheses:
– H₀: μ₁ = μ₂ = μ₃ = μ₄
– H₁: At least one mean is different.
2. Calculate the sum of squares between groups (SSB) and within groups (SSW).
3. Compute the F-statistic:
\[
F = \frac{SSB / (k – 1)}{SSW / (N – k)}
\]
where \( k \) is the number of groups and \( N \) is the total sample size.
4. Compare the calculated F-value with the critical F-value (F-tab = 3.4903).
5. If the calculated F-value > F-tab, reject H₀, indicating significant differences among the means.
—


