
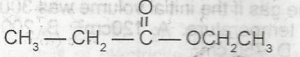

Use the option above to answer this question. The graph that describes a zero order reaction is
- A. A
- B. B
- C. C
- D. D
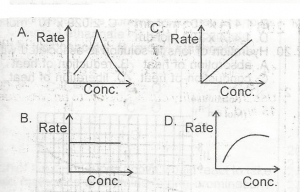
The diagram above is the solubility curve of a solute, X. Find the amount of X deposited when 500cm3 of a solution of X is cooled from 60oC to 20oC.
- A. 0.750 mole
- B. 0.950 mole
- C. 2.375 moles
- D. 4.750 moles
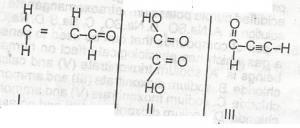
Which of the compounds above would react to take up two molecules of bromine durng bromination?
- A. l only
- B. lll only
- C. l and ll only
- D. ll and lll only
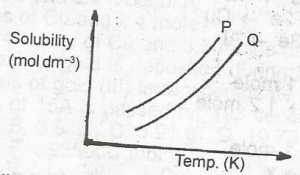
In the diagram above, the mixture of the solids P and Q can be separated by?
- A. distillation
- B. fractional distillation
- C. crystallization
- D. fractional crystallization
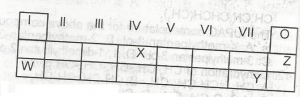
Use the table above to answer this question .The least reactive element is
- A. W
- B. X
- C. Y
- D. Z

Use the table above to answer this question . The element that is likely to participate in covalent rather than ionic bonding is
- A. Z
- B. Y
- C. X
- D. W
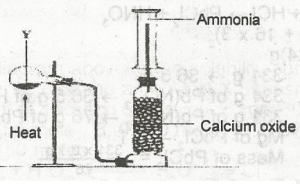
In the diagram above, Y is a mixture of
- A. calcium hydroxide and ammonium chloride
- B. calcuim hydroxide and sodium chloride
- C. sodium chloride and ammonuim trioxonitrate (V)
- D. sodium dioxonitrate (lll) and ammouium chloride
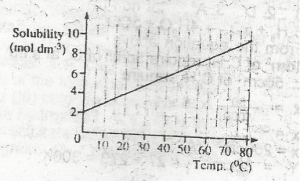
From the diagram above the mass of crystals deposited when 1 dm 3 of a saturated solution of NaCl is cooled from 80 oC to 60oC is
[Na = 23, Cl = 35.5]
- A. 117.00 g
- B. 58.50 g
- C. 11.70 g
- D. 5.85 g
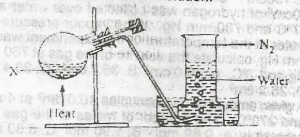
In the experiment above, X could be a solution of
- A. sodium trioxonitrate (V) and ammonium chloride
- B. sodium trioxonitrate (lll) and ammonium chloride
- C. lead (ll) trioxonitrate (V) and copper turnings
- D. potassium trioxonitrate (V) and copper turnings
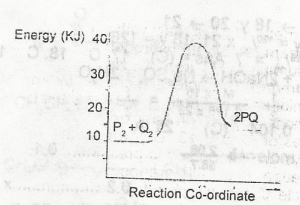
In the diagram above , the activation energy for the backward reaction is
- A. +5kJ
- B. +15KJ
- C. +25KJ
- D. +30KJ

The diagram above represents an atom that can combine with chlorine to form
- A. a covalent bond
- B. an electrovalent bond
- C. a hydrogen bond
- D. a co-ordinate bond
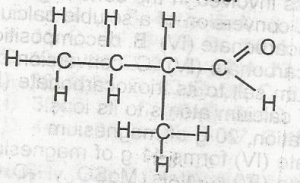
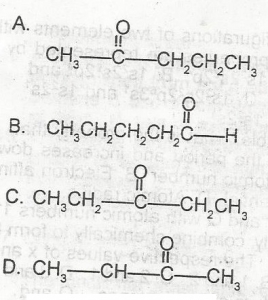
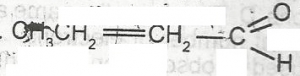
The compound above is the product of the oxidation of
- A. 2-methlbutan-2-ol
- B. 2-methylbutan -1- ol
- C. 2, 3-dimethylprop 1-ol
- D. Pentan -2- ol
The compound above contains
- A. Sp 3 hybridized carbon atoms only
- B. Sp 2 hybridized carbon atoms only
- C. Sp 3 and Sp hybirdized carbon atoms
- D. Sp 3 and Sp 2
Choose the correct answer from the options above. When Fehling is solution is added to two isomeric carbonyl compounds X and Y with the molecular formula C 5H 10O, compound X gives a red precipitate while Y does not react. It can be inferred that X is
- A. A
- B. B
- C. C
- D. D
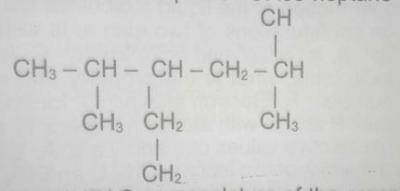
How many more isomers of the compound above can be obtained ?
- A. 5
- B. 4
- C. 3
- D. 2
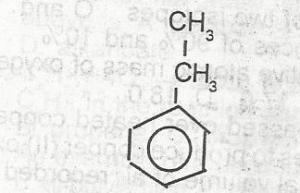
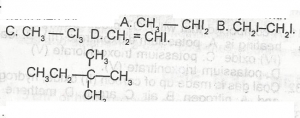
The IUPAC nomenclature of the organic compound with the above structural formula is
- A. 3-ethyl-2,5-dimethylhexane
- B. 4-ethyl-2,5-dimethylhexane
- C. 3-ethyl-2,5,5 - trimethylpentane
- D. 3-ethyl, 1,1,4-trimethylpentane
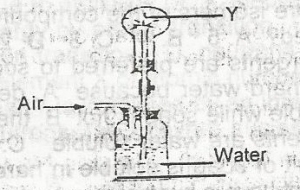
In the diagram above the gas Y could be
- A. hydrogen chloride
- B. oxygen
- C. carbon (IV) oxide
- D. chlorine

Use the graph above to answer this question. A sample, X, solid at room temperature, was melted, heated to a temperature of 358 K and allowed to cool as shown in OPQR.The section OP suggests that X is in the
- A. liquid sate
- B. solid/liquid state
- C. solid state
- D. gaseous state
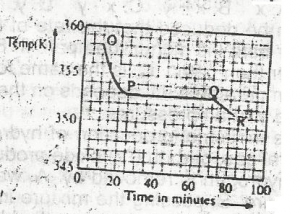
Use the graph above to answer this question. A sample, X, solid at room temperature, was melted, heated to a temperature of 358 K and allowed to cool as shown in OPQR. The section PQ indicates that X is
- A. a mixture of salts
- B. a hydrated salt
- C. an ionic salt
- D. a pure compound
The functional group represented in the compound above is?
- A. alkanol
- B. alkanal
- C. alkanone
- D. alanoate